
The first half of my second semester was focused on learning a piece of computer software called Quantum GSI (QGIS). QGIS is an free use Geographic Information System that enables the user to manage, analyse, and visualise geographic data. You can create data layers which enables analysis of different data sets. Its used by MWT ecologists to map specific geological and ecological data and also in our consultancy services to create maps and plot species locations and sightings. These maps are then used for all sorts of things including within the planing system.
Rey's Masters Blog - 3

Find out all about the first half of Rey's second semester!

Raster vector comparison ©Steven Bedrick
There are two types of geospatial data file used in QGIS, raster and vector files. Rasta files are a rectangular array of regularly sampled values, known as pixels. Each pixel (picture element) has one or more numbers associated with it, specifying a colour which the pixel should be displayed in. Vector files are images that are built by mathematical formulas that establish points on a grid.
The main difference between Raster and Vector data is that the raster data represents data as a cell or a grid matrix while vector data represents data using sequential points or vertices.
Data can be stored within shape files (vector) or picture files (raster) which can then be extrapolated, analysed and cross analysed with other data points.
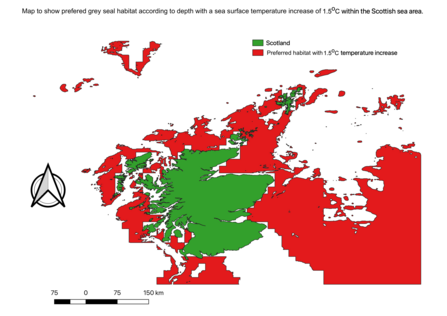
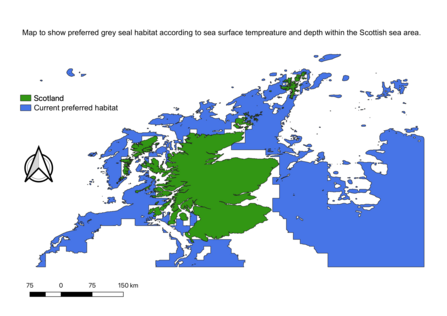
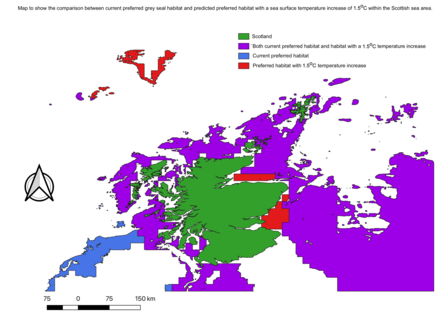
For my assignment I had to use the Scottish sea area and plot the preferred habitat of the grey seal, with maps to show preferred habitat now and with a projected sea surface temperature (SST) increase of 1.5oC. This was done by using raster files containing ocean depth data and SST data. The data was combined and cut leaving a shape file containing the area of preferred habitat, an ocean depth of less than 100m deep and a SST of between 10 and 13oC. I then mapped the preferred habitat with a 1.5oC SST increase.
Within this I had to use a shape file containing grey seal location data to determine the percentage of seals that were seen in preferred habitat now and how this would be projected to change with a SST increase.
This project wasn’t like anything I’d done before, but learning how to use QGIS was very interesting and will undoubtably be a useful skill
My next assignment is looking at marine protected areas (MPAs) and how these are designated.